Symbol Size Mapping
Value
A palette function that when called with a single argument
(a numeric vector of continuous values) returns a numeric vector
giving the amount by which plotting text and symbols should be magnified
relative to the default.
See also
Other palettes:
palette_color_continuous(),
palette_color_discrete(),
palette_color_picker(),
palette_shape()
Examples
## Visualize a simple DEM model
## Distribution of elevation values
elevation <- hist(volcano)
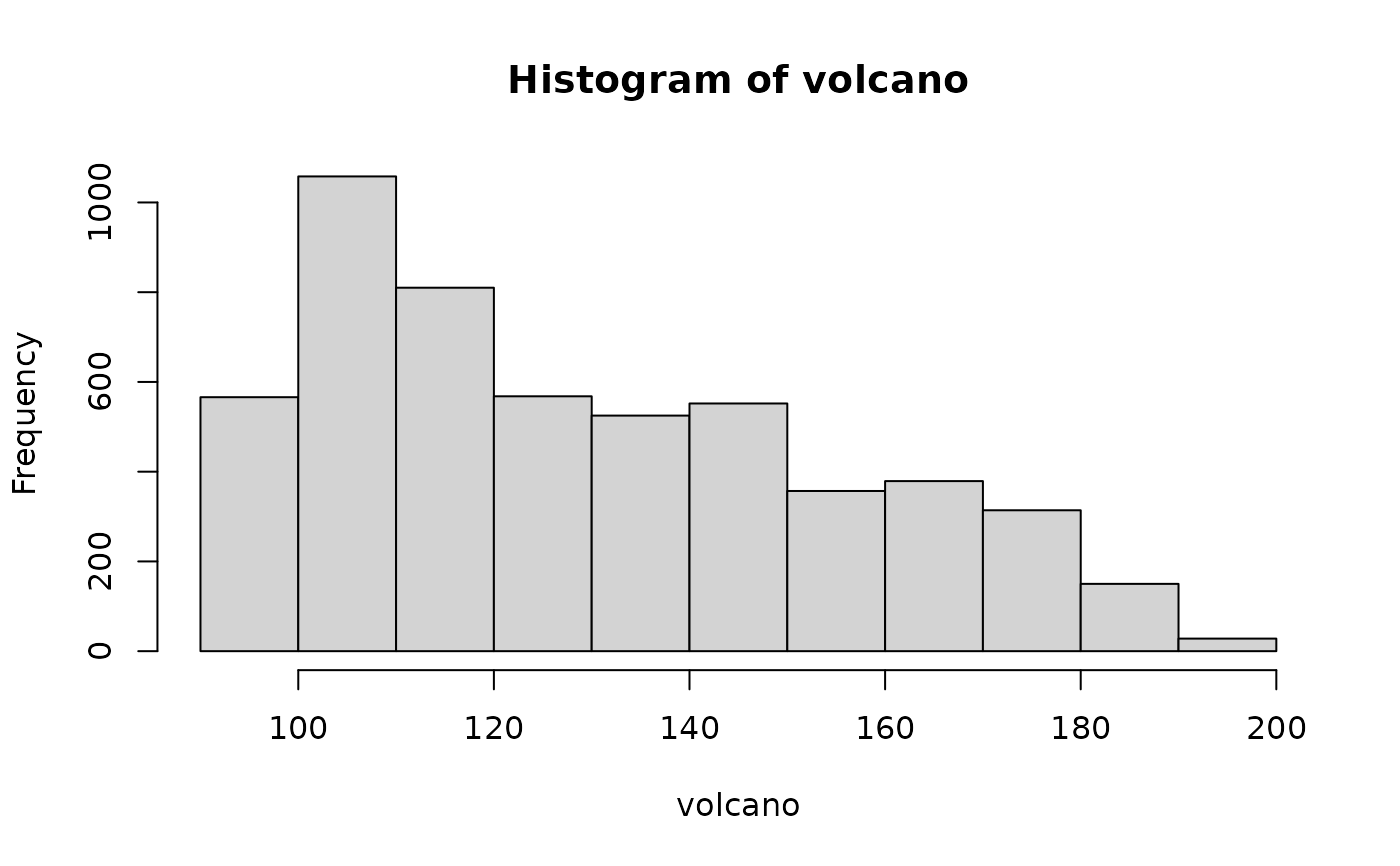 ## Where are breaks?
elevation$breaks
#> [1] 90 100 110 120 130 140 150 160 170 180 190 200
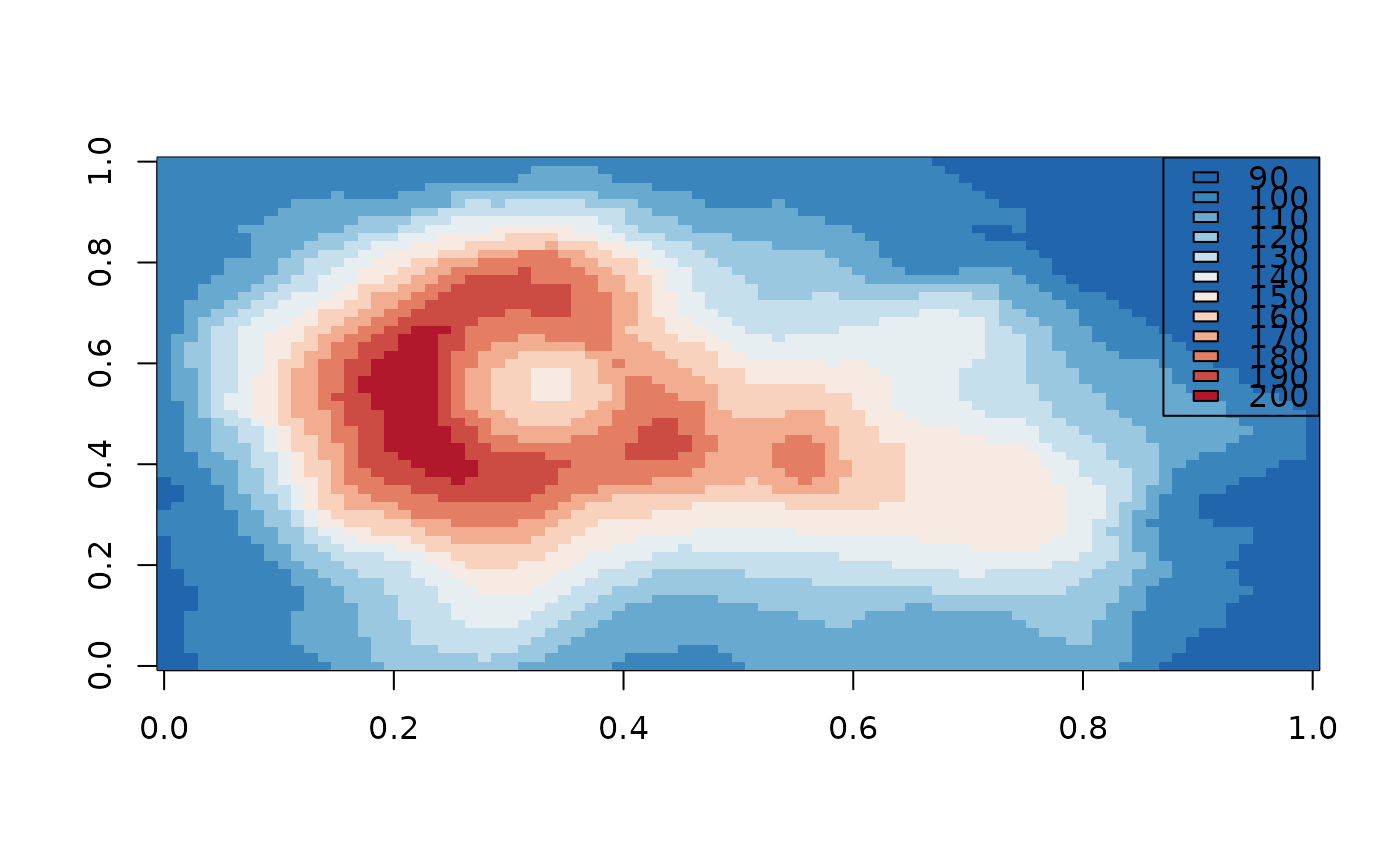
## Build palette functions
BuRd <- color("BuRd")
ramp_BuRd <- palette_color_continuous(colors = BuRd(10))
## Plot image
image(volcano, col = ramp_BuRd(elevation$breaks))
legend("topright", legend = elevation$breaks, fill = ramp_BuRd(elevation$breaks))
## Where are breaks?
elevation$breaks
#> [1] 90 100 110 120 130 140 150 160 170 180 190 200
## Build palette functions
BuRd <- color("BuRd")
ramp_BuRd <- palette_color_continuous(colors = BuRd(10))
## Plot image
image(volcano, col = ramp_BuRd(elevation$breaks))
legend("topright", legend = elevation$breaks, fill = ramp_BuRd(elevation$breaks))
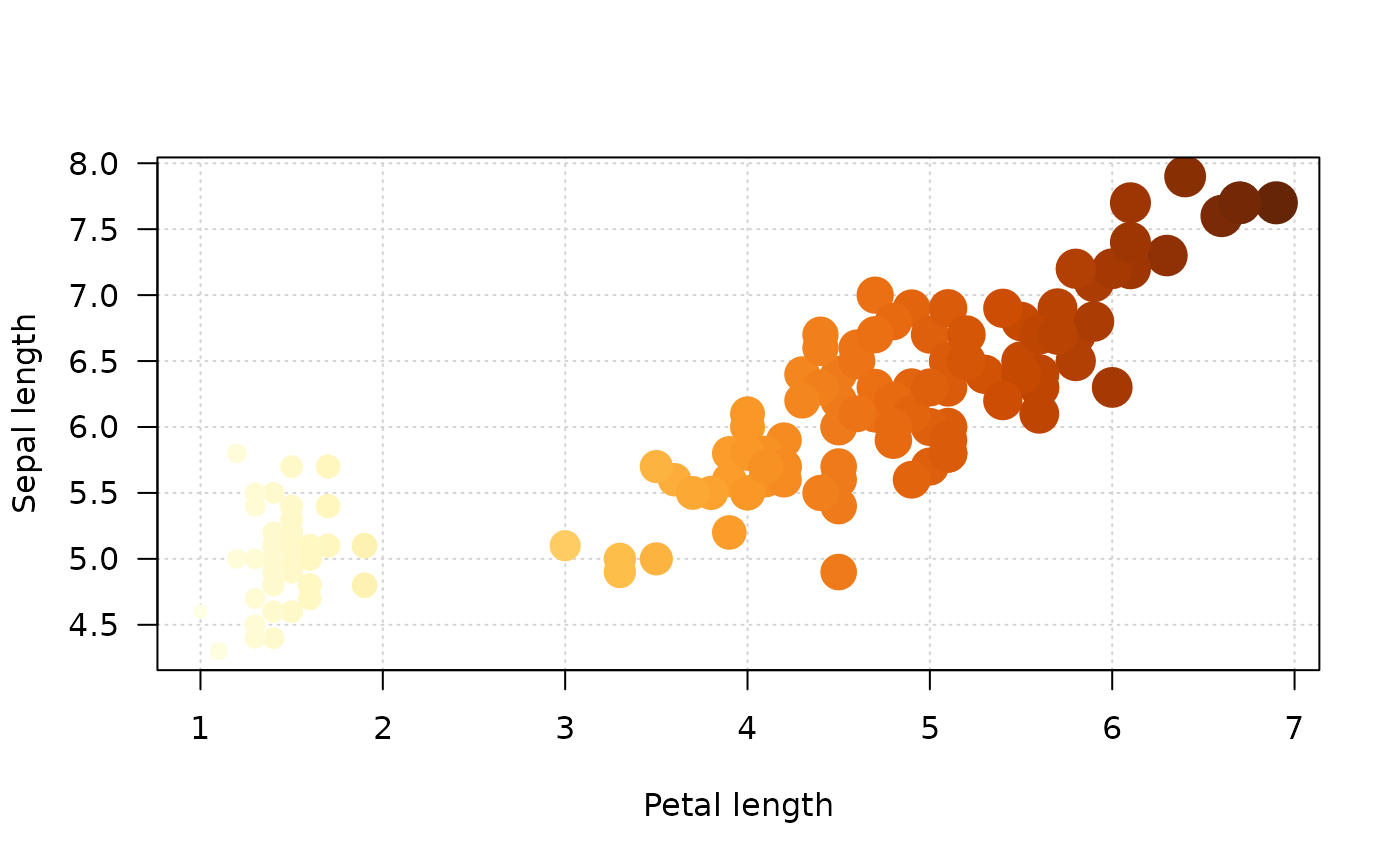
 ## Scatter plot
## Build color palette functions
YlOrBr <- color("YlOrBr")
pal_color <- palette_color_continuous(colors = YlOrBr)
## Build symbol palette functions
pal_size <- palette_size_sequential(range = c(1, 3))
## Plot
plot(
x = iris$Petal.Length,
y = iris$Sepal.Length,
pch = 16,
col = pal_color(iris$Petal.Length),
cex = pal_size(iris$Petal.Length),
xlab = "Petal length",
ylab = "Sepal length",
panel.first = grid(),
las = 1
)
## Scatter plot
## Build color palette functions
YlOrBr <- color("YlOrBr")
pal_color <- palette_color_continuous(colors = YlOrBr)
## Build symbol palette functions
pal_size <- palette_size_sequential(range = c(1, 3))
## Plot
plot(
x = iris$Petal.Length,
y = iris$Sepal.Length,
pch = 16,
col = pal_color(iris$Petal.Length),
cex = pal_size(iris$Petal.Length),
xlab = "Petal length",
ylab = "Sepal length",
panel.first = grid(),
las = 1
)