Symbol Mapping
Usage
palette_shape(symbols = NULL, domain = NULL, ordered = FALSE, ...)

palette_line(types = NULL, domain = NULL, ordered = FALSE, ...)
Arguments
- symbols, types
A vector of symbols or line types.
- domain
A vector of categorical data specifying the possible values that can be mapped.
- ordered
A
logicalscalar: should the levels be treated as already in the correct order?- ...
Currently not used.
Value
A palette function that when called with a single argument
(a character vector of categorical values) returns a vector of symbols.
See also
Other palettes:
palette_color_continuous(),
palette_color_discrete(),
palette_color_picker(),
palette_size
Examples
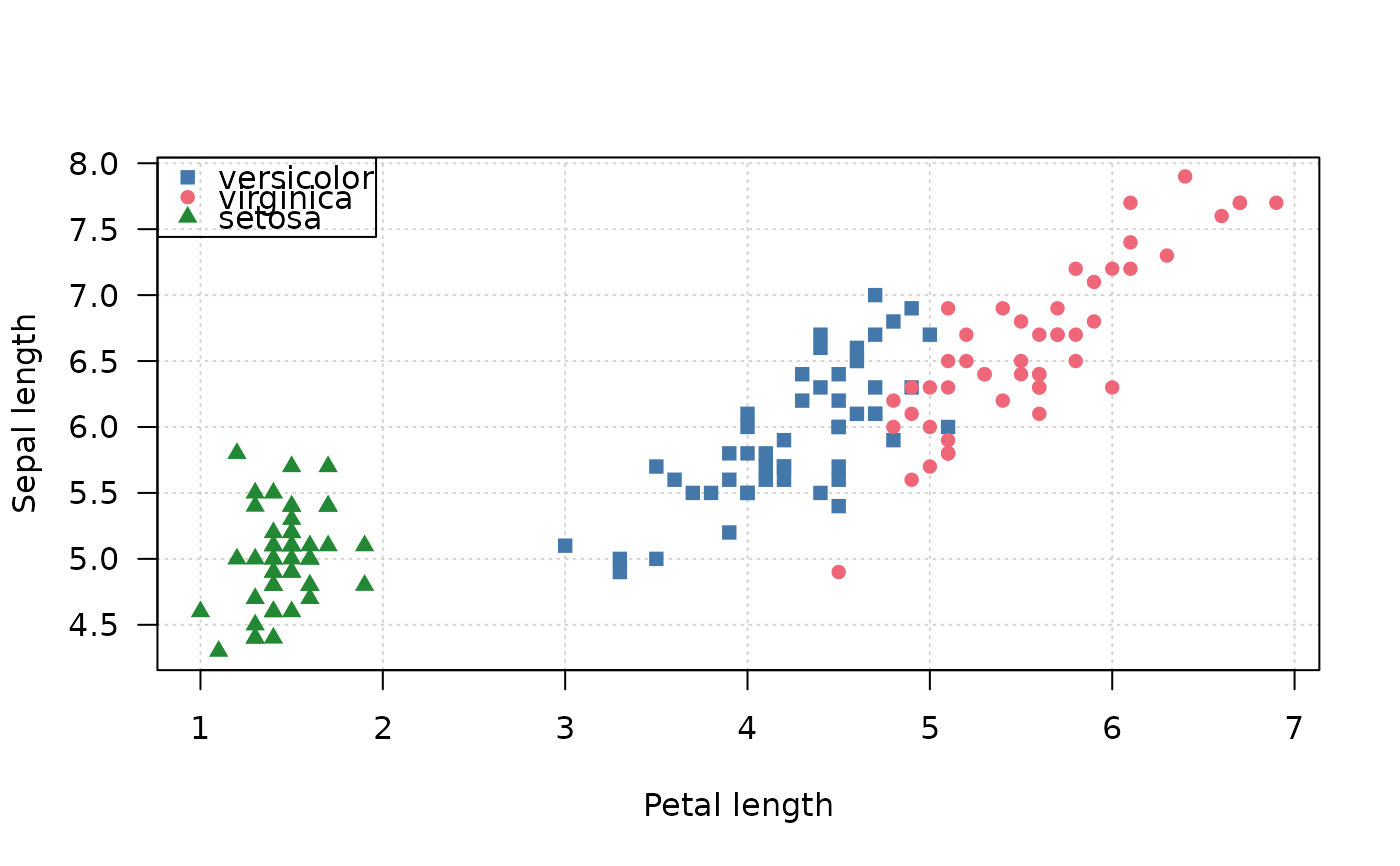
## Scatter plot
## Build color palette functions
bright <- c(versicolor = "#4477AA", virginica = "#EE6677", setosa = "#228833")
pal_color <- palette_color_discrete(colors = bright)

## Build symbol palette functions
symbols <- c(versicolor = 15, virginica = 16, setosa = 17)
pal_shapes <- palette_shape(symbols)

## Plot
plot(
  x = iris$Petal.Length,
  y = iris$Sepal.Length,
  pch = pal_shapes(iris$Species),
  col = pal_color(iris$Species),
  xlab = "Petal length",
  ylab = "Sepal length",
  panel.first = grid(),
  las = 1
)
legend("topleft", legend = names(bright), col = bright, pch = symbols)