Maps continuous values to an interpolated colors gradient.
Usage
palette_color_continuous(
  colors = NULL,
  domain = NULL,
  midpoint = NULL,
  missing = "#DDDDDD"
)

palette_colour_continuous(
  colors = NULL,
  domain = NULL,
  midpoint = NULL,
  missing = "#DDDDDD"
)
Arguments
- colors
A vector of colors or a
functionthat when called with a single argument (an integer specifying the number of colors) returns a vector of colors. IfNULL(the default), uses YlOrRd.- domain
A
numericrange specifying the possible values that can be mapped.- midpoint
A length-one
numericvector specifying the mid-point of input range.- missing
The color to return for
NAvalues.
Value
A palette function that when called with a single argument
(a numeric vector of continuous values) returns a character vector
of colors.
Examples
## Visualize a simple DEM model
## Distribution of elevation values
elevation <- hist(volcano)
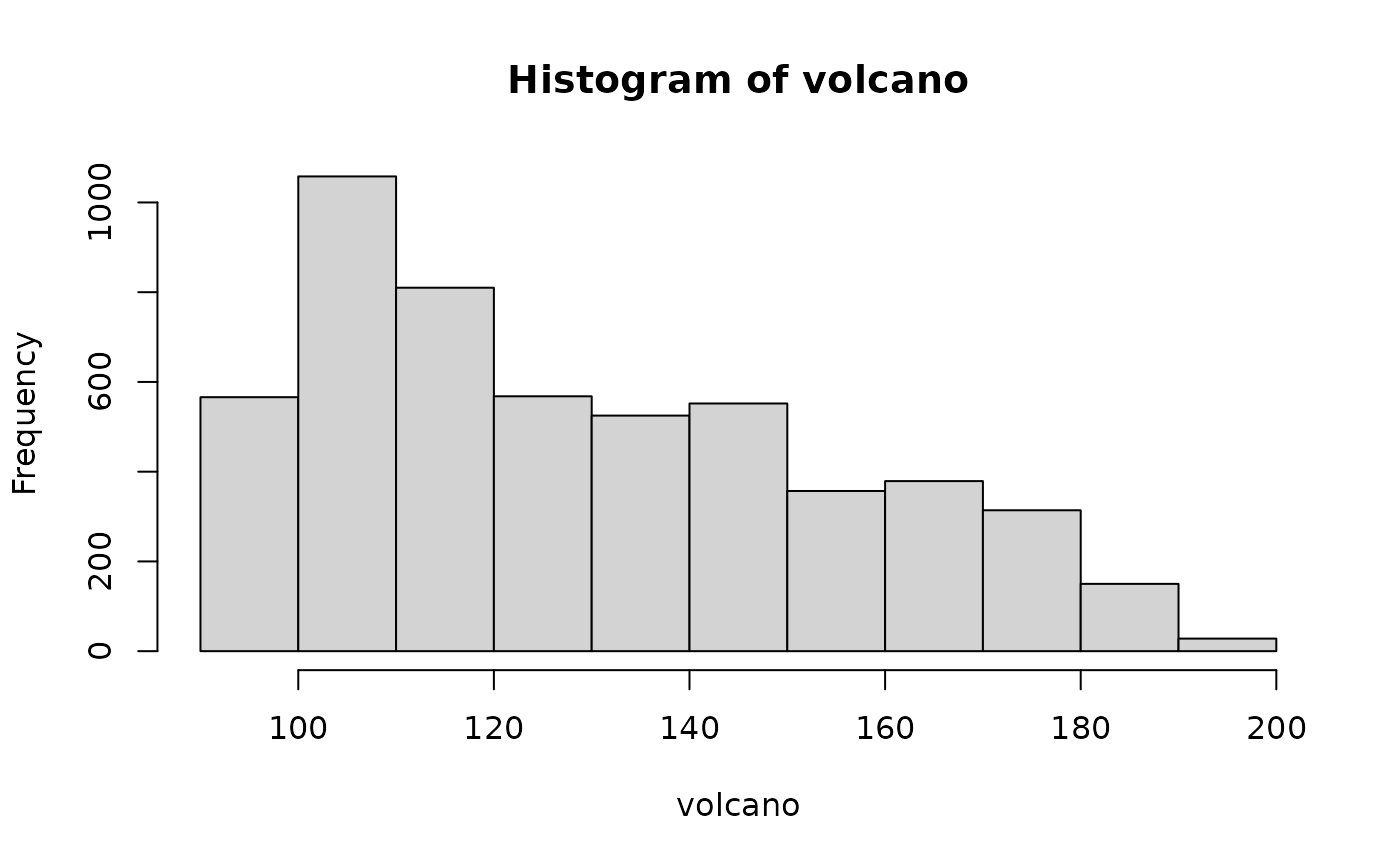 ## Where are breaks?
elevation$breaks
#> [1] 90 100 110 120 130 140 150 160 170 180 190 200
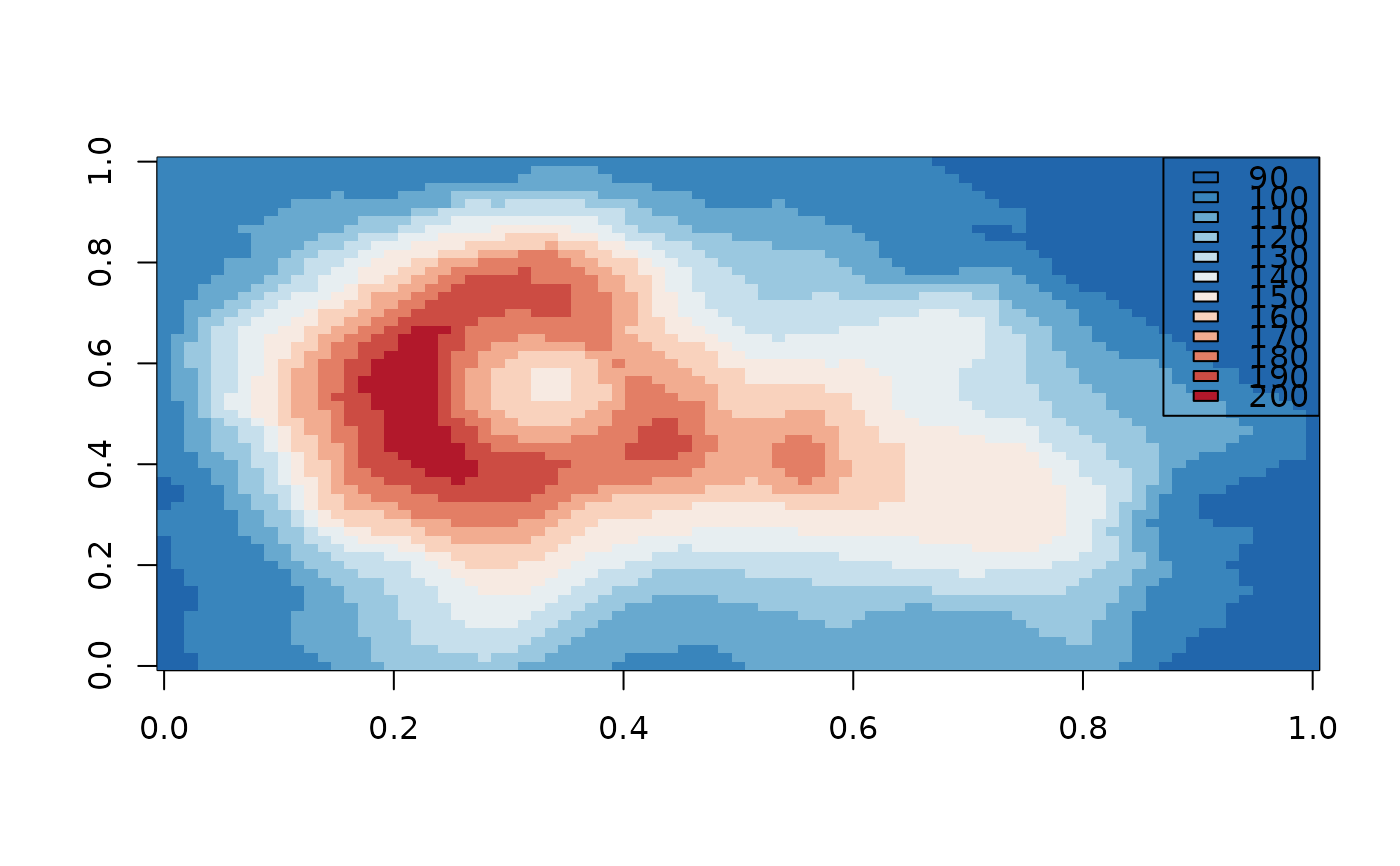
## Build palette functions
BuRd <- color("BuRd")
ramp_BuRd <- palette_color_continuous(colors = BuRd(10))
## Plot image
image(volcano, col = ramp_BuRd(elevation$breaks))
legend("topright", legend = elevation$breaks, fill = ramp_BuRd(elevation$breaks))
## Where are breaks?
elevation$breaks
#> [1] 90 100 110 120 130 140 150 160 170 180 190 200
## Build palette functions
BuRd <- color("BuRd")
ramp_BuRd <- palette_color_continuous(colors = BuRd(10))
## Plot image
image(volcano, col = ramp_BuRd(elevation$breaks))
legend("topright", legend = elevation$breaks, fill = ramp_BuRd(elevation$breaks))
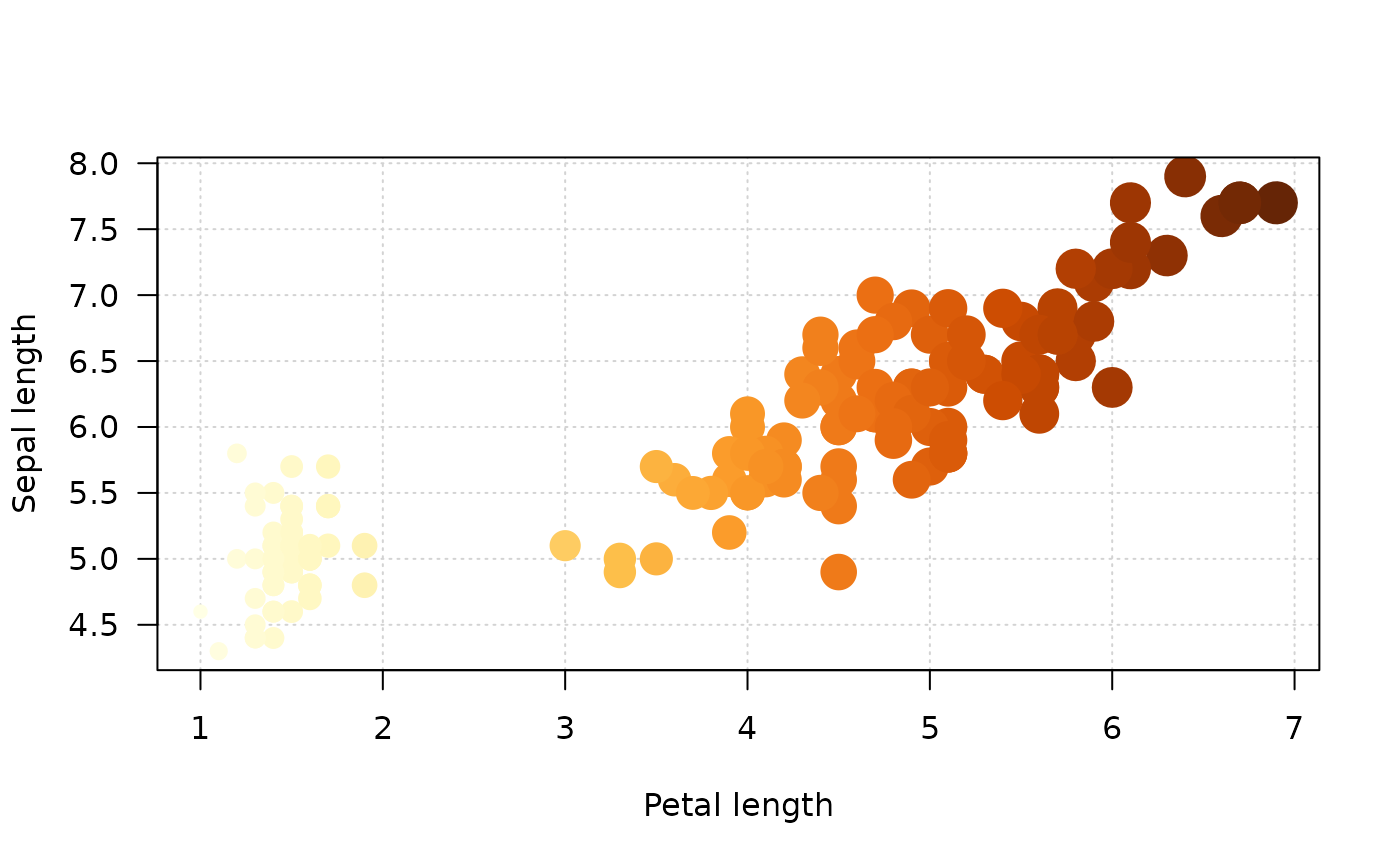
 ## Scatter plot
## Build color palette functions
YlOrBr <- color("YlOrBr")
pal_color <- palette_color_continuous(colors = YlOrBr)
## Build symbol palette functions
pal_size <- palette_size_sequential(range = c(1, 3))
## Plot
plot(
x = iris$Petal.Length,
y = iris$Sepal.Length,
pch = 16,
col = pal_color(iris$Petal.Length),
cex = pal_size(iris$Petal.Length),
xlab = "Petal length",
ylab = "Sepal length",
panel.first = grid(),
las = 1
)
## Scatter plot
## Build color palette functions
YlOrBr <- color("YlOrBr")
pal_color <- palette_color_continuous(colors = YlOrBr)
## Build symbol palette functions
pal_size <- palette_size_sequential(range = c(1, 3))
## Plot
plot(
x = iris$Petal.Length,
y = iris$Sepal.Length,
pch = 16,
col = pal_color(iris$Petal.Length),
cex = pal_size(iris$Petal.Length),
xlab = "Petal length",
ylab = "Sepal length",
panel.first = grid(),
las = 1
)