matrigraph()produces a heatmap highlighting the deviations from independence.pvi()computes for each cell of a numeric matrix the percentage to the column theoretical independence value.
Usage
matrigraph(object, ...)

pvi(object, ...)

# S4 method for class 'matrix'
pvi(object)

# S4 method for class 'data.frame'
pvi(object)

# S4 method for class 'matrix'
matrigraph(object, reverse = FALSE, axes = TRUE, ...)

# S4 method for class 'data.frame'
matrigraph(object, reverse = FALSE, ...)
Arguments
- object
A \(m \times p\)
numericmatrixordata.frameof count data (absolute frequencies giving the number of individuals for each category, i.e. a contingency table).- ...
Currently not used.
- reverse
A
logicalscalar: should negative deviations be centered (see details)?- axes
A
logicalscalar: should axes be drawn on the plot? It will omit labels where they would abut or overlap previously drawn labels.
Details
PVI (in french "pourcentages de valeur d'indépendance") is calculated for each cell as the percentage to the column theoretical independence value: PVI greater than \(1\) represent positive deviations from the independence, whereas PVI smaller than \(1\) represent negative deviations (Desachy 2004).
The PVI matrix allows to explore deviations from independence (an intuitive approach to \(\chi^2\)), in such a way that a high-contrast matrix has quite significant deviations, with a low risk of being due to randomness (Desachy 2004).
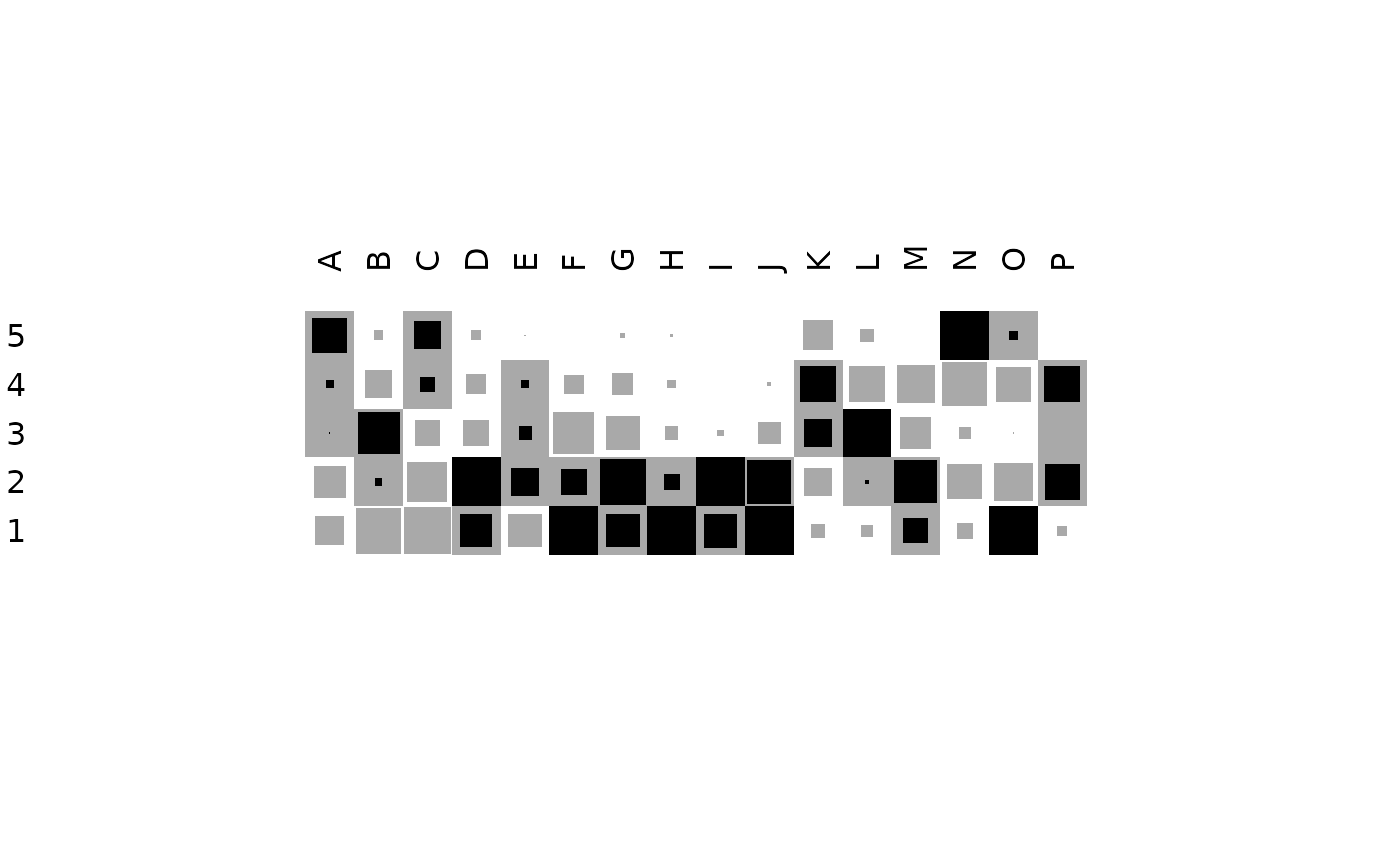
matrigraph() displays the deviations from independence:
If the PVI is equal to \(1\) (statistical independence), the cell of the matrix is filled in grey.
If the PVI is less than \(1\) (negative deviation from independence), the size of the grey square is proportional to the PVI (the white margin thus represents the fraction of negative deviation).
If the PVI is greater than \(1\) (positive deviation), a black square representing the fraction of positive deviations is superimposed. For large positive deviations (PVI greater than \(2\)), the cell in filled in black.
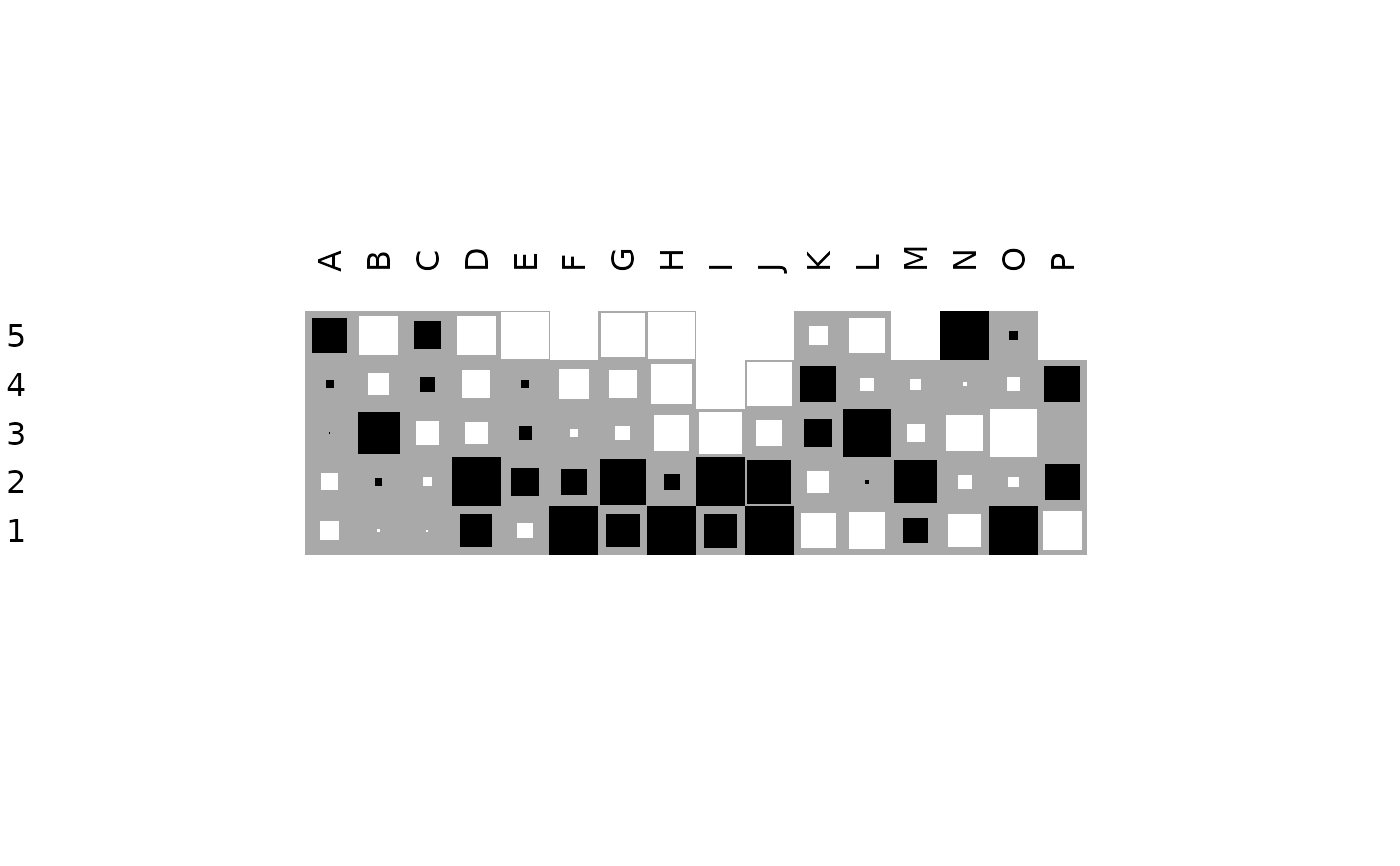
If reverse is TRUE, the fraction of negative deviations is displayed
as a white square.
References
Desachy, B. (2004). Le sériographe EPPM: un outil informatisé de sériation graphique pour tableaux de comptages. Revue archéologique de Picardie, 3(1), 39-56. doi:10.3406/pica.2004.2396 .
See also
Other plot methods:
plot_bertin(),
plot_diceleraas(),
plot_ford(),
plot_heatmap(),
plot_rank(),
plot_spot(),
seriograph()
Examples
## Data from Desachy 2004
data("compiegne", package = "folio")

## Matrigraph
matrigraph(compiegne)

matrigraph(compiegne, reverse = TRUE)


## Compute PVI
counts_pvi <- pvi(compiegne)
plot_heatmap(counts_pvi, col = khroma::color("iridescent")(12))
## Compute PVI
counts_pvi <- pvi(compiegne)
plot_heatmap(counts_pvi, col = khroma::color("iridescent")(12))