Displays a compositional bar chart.
Usage
# S4 method for class 'CompositionMatrix'
barplot(
  height,
  ...,
  order_columns = FALSE,
  order_rows = NULL,
  decreasing = TRUE,
  names = TRUE,
  space = 0.2,
  offset = 0.025,
  color = NULL,
  border = NA,
  axes = TRUE,
  legend = TRUE
)
Arguments
- height
A
CompositionMatrixobject.- ...
Further graphical parameters.
- order_columns
A
logicalscalar: should should columns be reorderd?- order_rows
An
integervector giving the index of the column to be used for the ordering of the data.- decreasing
A
logicalscalar: should the sort order of rows be increasing or decreasing?- names
A
logicalscalar: should row names be displayed?- space
A length-one
numericvector giving the the amount of space (as a fraction of the width of a bar) left between each bar (defaults to \(0.2\)).- offset
A length-one
numericvector giving the the amount of space (as a fraction) left between groups (defaults to \(0.025\)). Only used ifgroupsis notNULL.- color
A (named) vector of colors (will be mapped to the group names of
object) or afunctionthat when called with a single argument (an integer specifying the number of colors) returns a vector of colors.- border
The color to draw the borders.
- axes
A
logicalscalar: should axes be drawn on the plot?- legend
A
logicalscalar: should the legend be displayed?
Value
barplot() is called for its side-effects: is results in a graphic being
displayed (invisibly return height).
See also
Other plot methods:
as_graph(),
boxplot(),
hist(),
pairs(),
plot
Examples
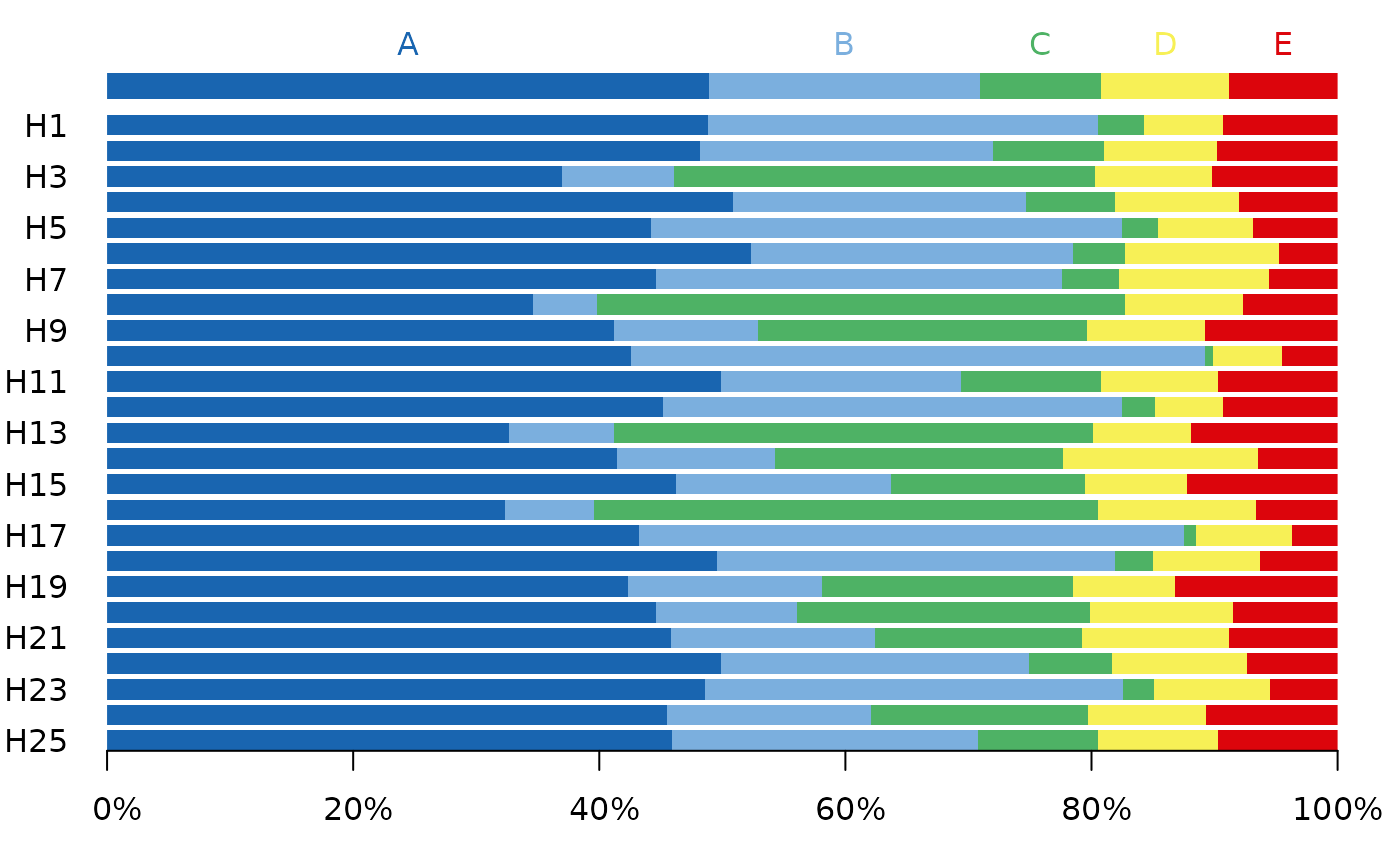
## Data from Aitchison 1986
data("hongite")
## Coerce to compositional data
coda <- as_composition(hongite)
## Bar plot
barplot(coda)
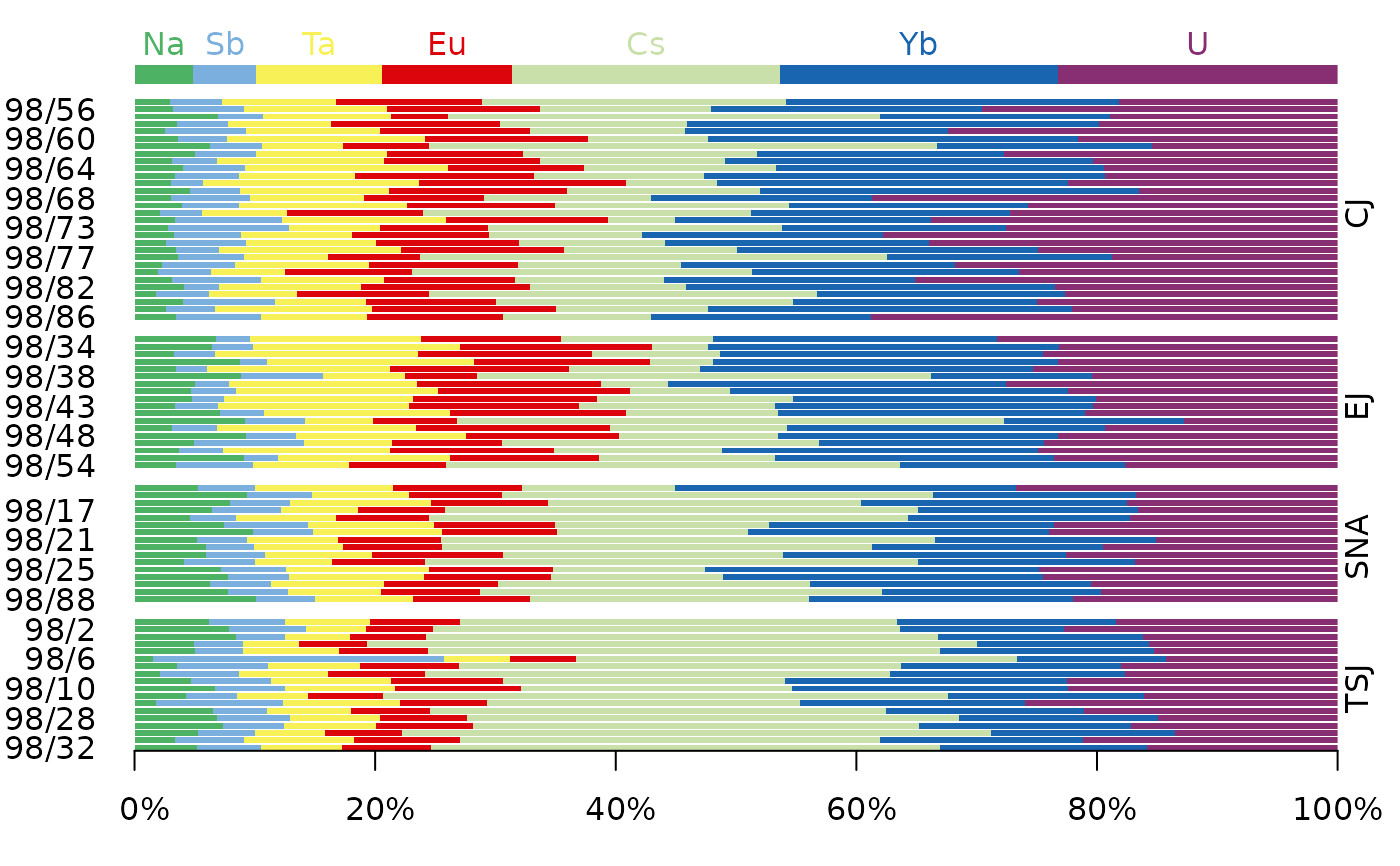
 ## Data from Day et al. 2011
data("kommos", package = "folio")
kommos <- remove_NA(kommos, margin = 1) # Remove cases with missing values
coda <- as_composition(kommos, groups = 1) # Coerce to compositional data
## Use ceramic types for grouping
barplot(coda, order_columns = TRUE)
## Data from Day et al. 2011
data("kommos", package = "folio")
kommos <- remove_NA(kommos, margin = 1) # Remove cases with missing values
coda <- as_composition(kommos, groups = 1) # Coerce to compositional data
## Use ceramic types for grouping
barplot(coda, order_columns = TRUE)
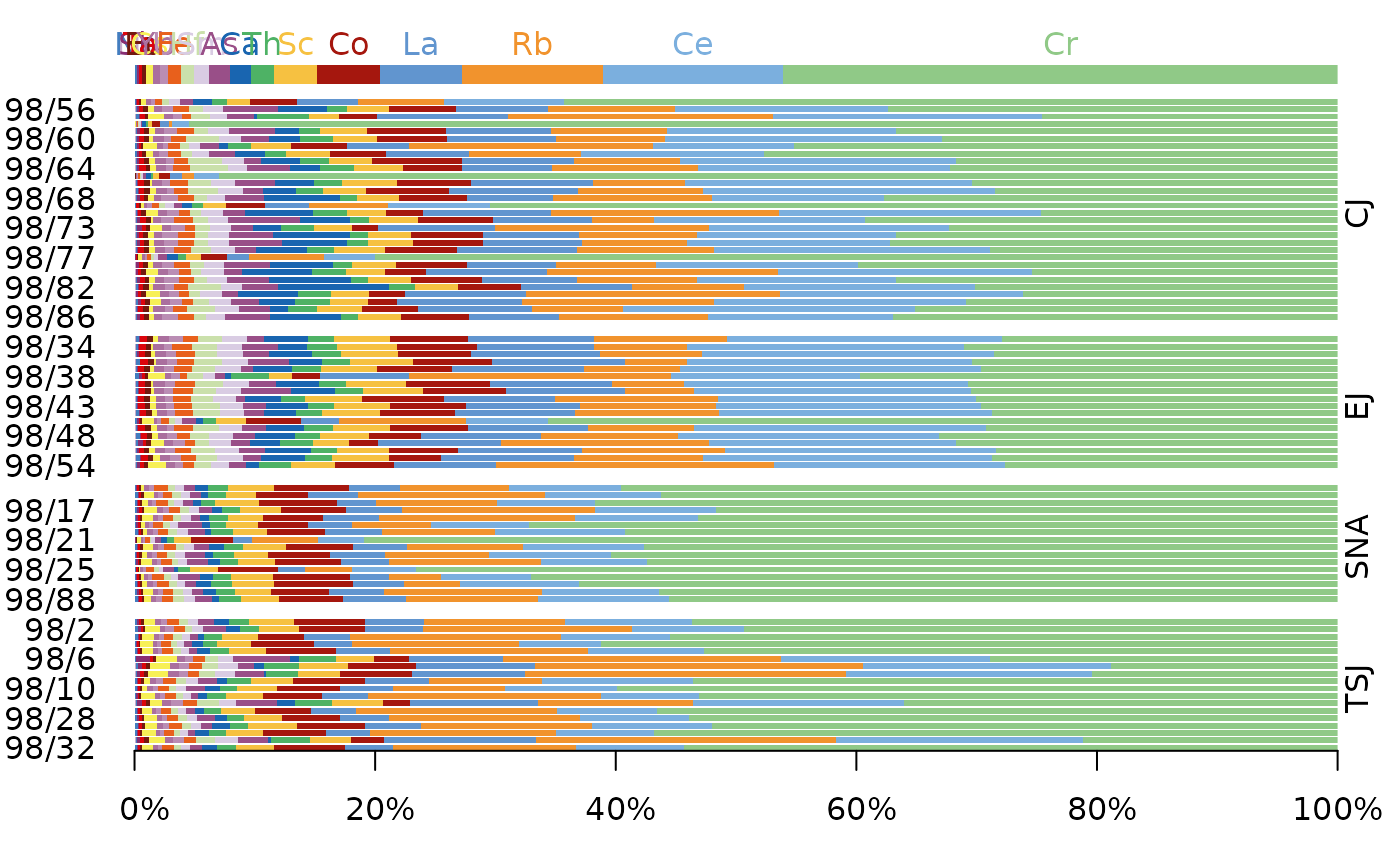 ## Display only minor elements
minor <- coda[, is_element_minor(coda)]
barplot(minor, order_columns = TRUE)
## Display only minor elements
minor <- coda[, is_element_minor(coda)]
barplot(minor, order_columns = TRUE)