Produces a graph of log-ratios.
Usage
as_graph(object, ...)

# S4 method for class 'LR'
as_graph(object)

# S4 method for class 'ALR'
as_graph(object)

# S4 method for class 'ILR'
as_graph(object)
Arguments
- object
A
LogRatioobject.- ...
Currently not used.
Examples
if (requireNamespace("igraph", quietly = TRUE)) {
library(igraph)
## Data from Aitchison 1986
data("hongite")
## Coerce to compositional data
coda <- as_composition(hongite)
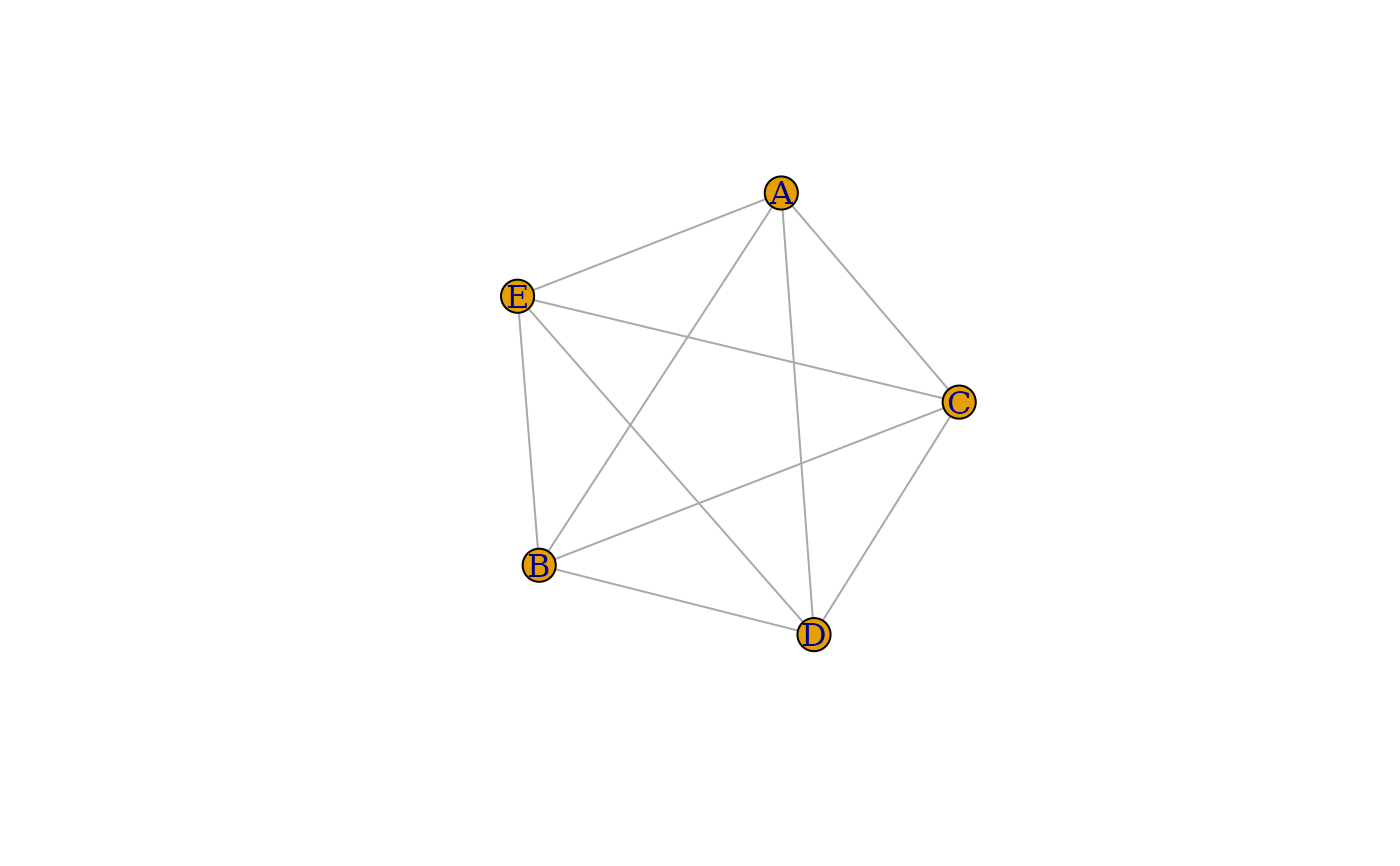
## Pairwise log-ratio
lr <- transform_lr(coda)
lr_graph <- as_graph(lr)
plot(lr_graph)
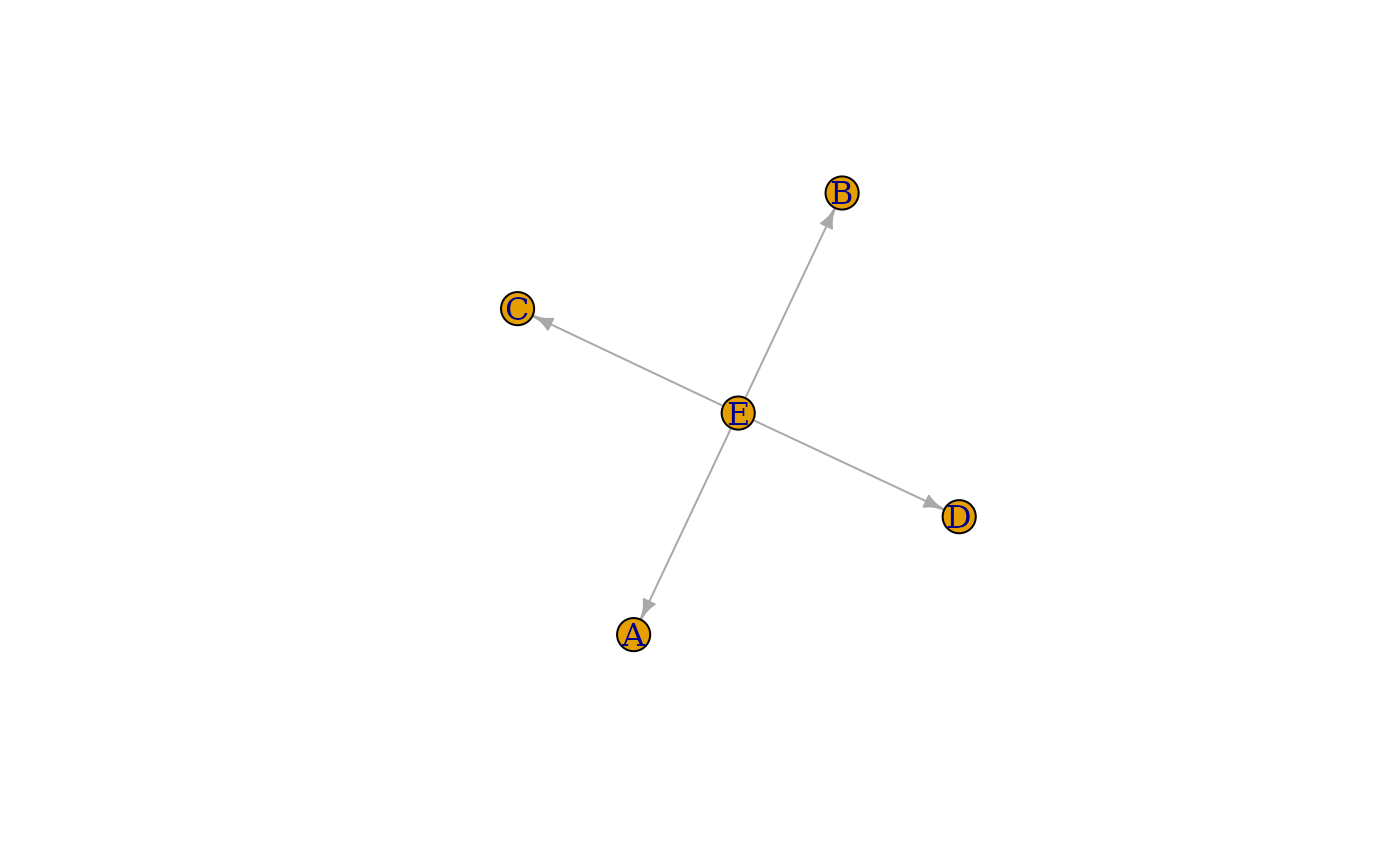
## Additive log-ratio
alr <- transform_alr(coda)
alr_graph <- as_graph(alr)
plot(alr_graph)
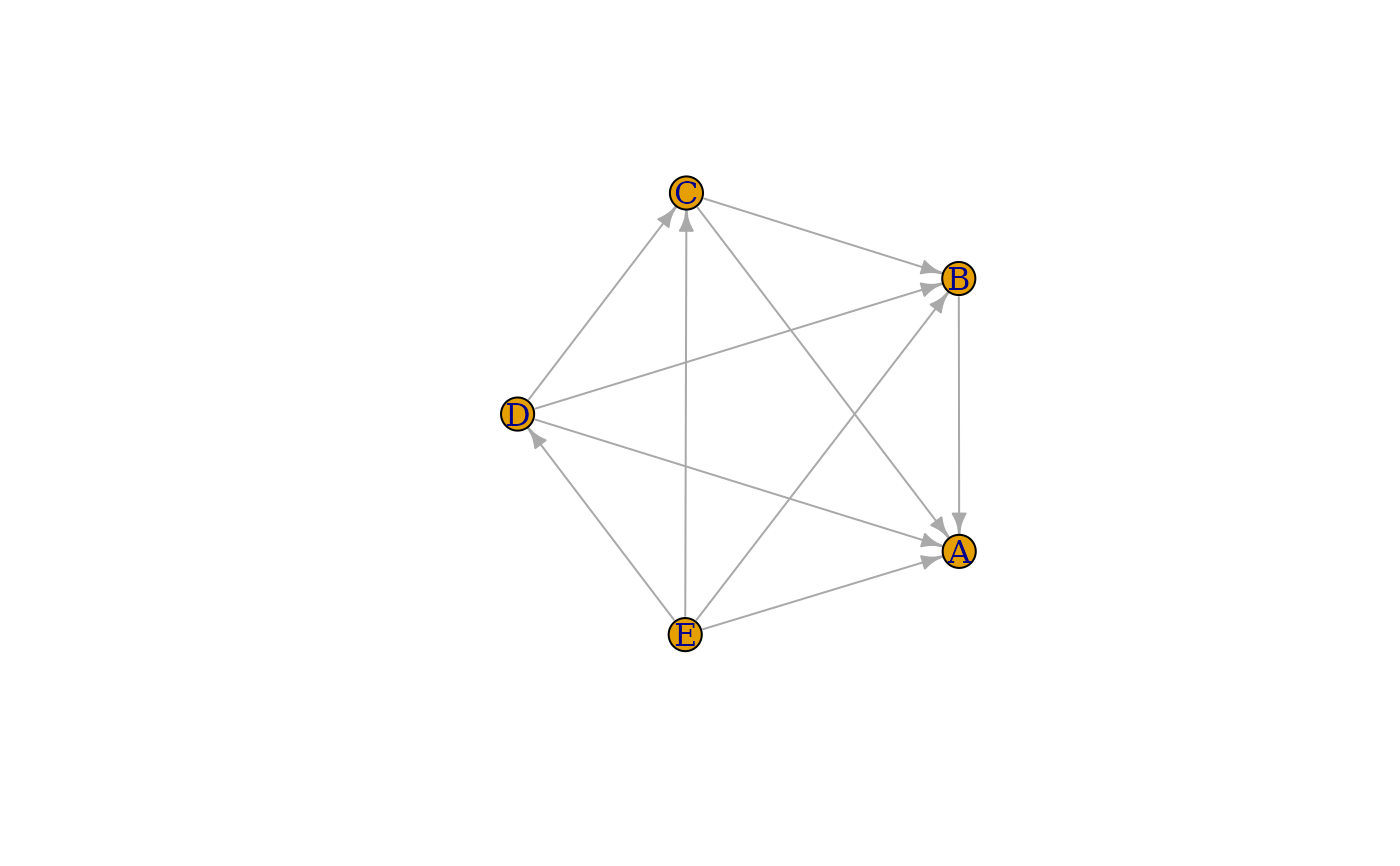
## Isometric log-ratio
ilr <- transform_ilr(coda)
ilr_graph <- as_graph(ilr)
plot(ilr_graph)
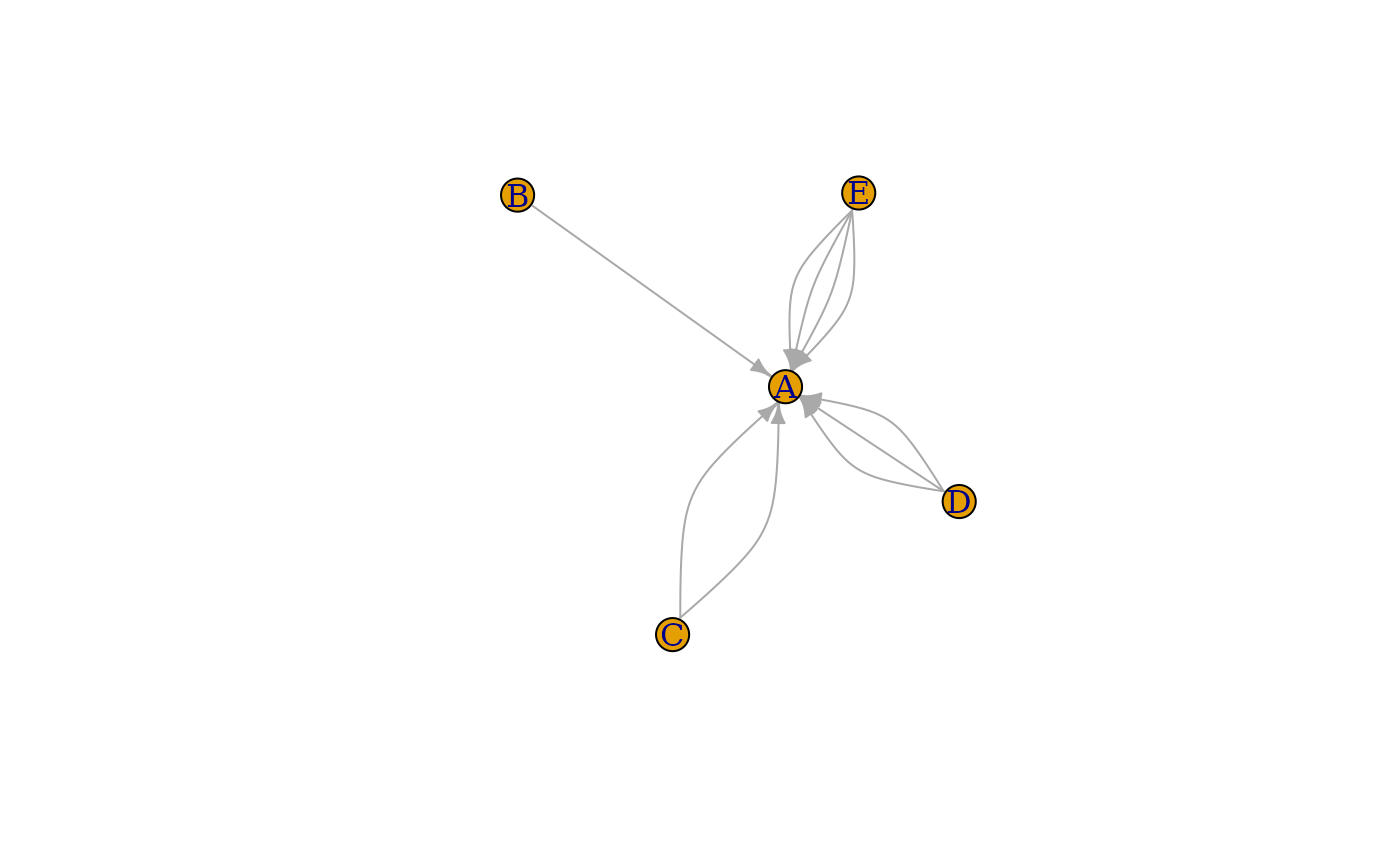
plr <- transform_plr(coda)
plr_graph <- as_graph(plr)
plot(plr_graph)
}
#>
#> Attaching package: ‘igraph’
#> The following objects are masked from ‘package:stats’:
#>
#> decompose, spectrum
#> The following object is masked from ‘package:base’:
#>
#> union