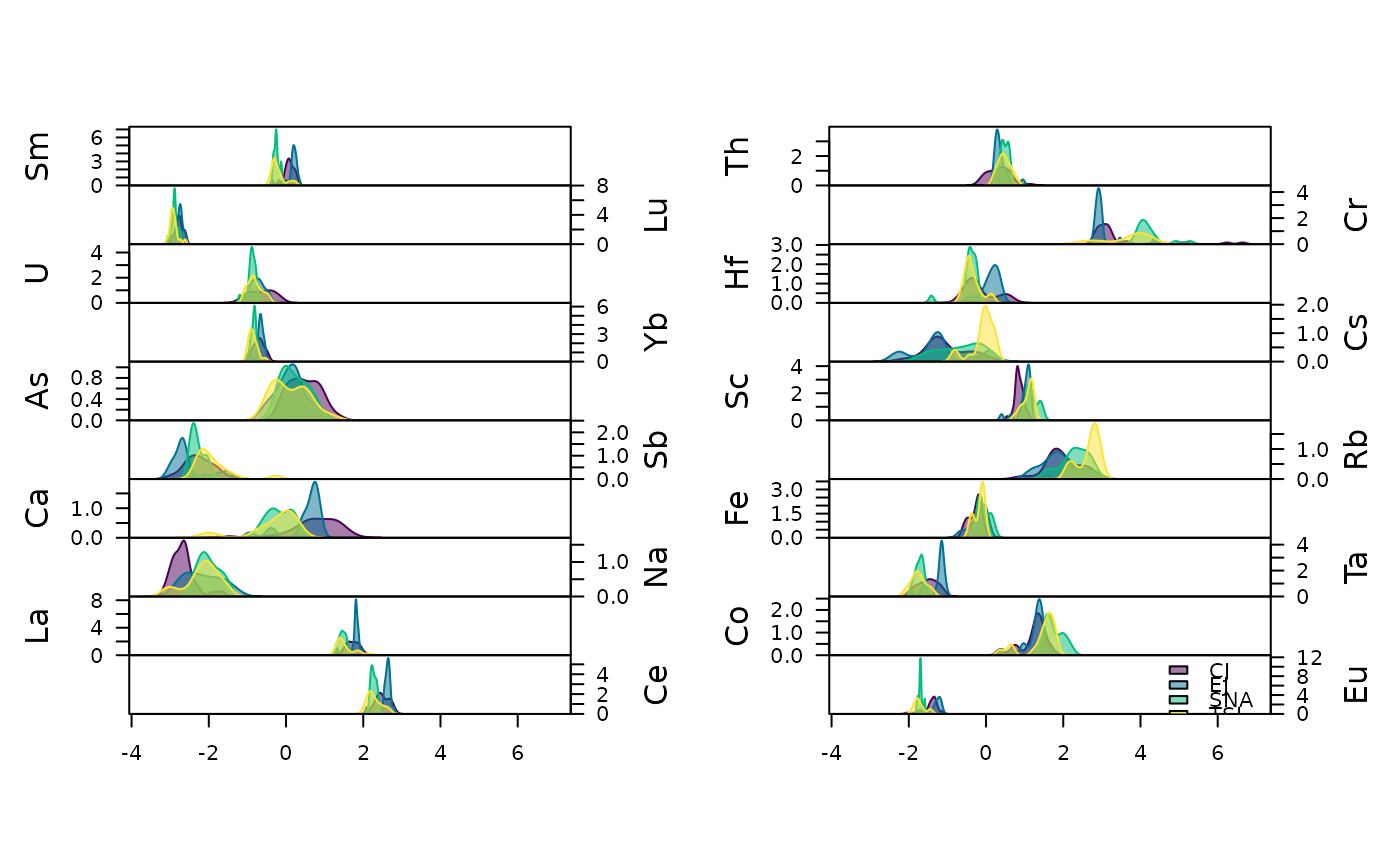
Displays a density plot.
Usage
# S4 method for class 'LogRatio,missing'
plot(
  x,
  ...,
  by = groups(x),
  color = palette_color_discrete(),
  rug = TRUE,
  ticksize = 0.05,
  ncol = NULL,
  flip = FALSE,
  xlab = NULL,
  ylab = NULL,
  main = NULL,
  ann = graphics::par("ann"),
  axes = TRUE,
  frame.plot = axes,
  legend = list(x = "top")
)
Arguments
- x
A
LogRatioobject.- ...
Further graphical parameters, particularly,
borderandcol.- by
A
vectorof grouping elements, as long as the variables inx. If set, a matrix of panels defined bygroupswill be drawn.- color
A palette
functionthat when called with a single argument returns acharactervector of colors.- rug
A
logicalscalar: should a rug representation (1-d plot) of the data be added to the plot?- ticksize
A length-one
numericvector giving the length of the ticks making up the rug. Positive lengths give inwards ticks. Only used ifrugisTRUE.- ncol
An
integerspecifying the number of columns to use. Defaults to 1 for up to 4 groups, otherwise to 2.- flip
A
logicalscalar: should the y-axis (ticks and numbering) be flipped from side 2 (left) to 4 (right) from variable to variable?- xlab, ylab
A
charactervector giving the x and y axis labels.- main
A
characterstring giving a main title for the plot.- ann
A
logicalscalar: should the default annotation (title and x and y axis labels) appear on the plot?- axes
A
logicalscalar: should axes be drawn on the plot?- frame.plot
A
logicalscalar: should a box be drawn around the plot?- legend
A
listof additional arguments to be passed tographics::legend(); names of the list are used as argument names. IfNULL, no legend is displayed.
Value
plot() is called for its side-effects: is results in a graphic being
displayed (invisibly return x).
Examples
## Data from Day et al. 2011
data("kommos", package = "folio") # Coerce to compositional data
kommos <- remove_NA(kommos, margin = 1) # Remove cases with missing values
coda <- as_composition(kommos, groups = 1)

## Log ratio
clr <- transform_clr(coda)

## Density plot
plot(clr, by = NULL, flip = TRUE)


## Use ceramic types for grouping
plot(clr, flip = TRUE)
## Use ceramic types for grouping
plot(clr, flip = TRUE)