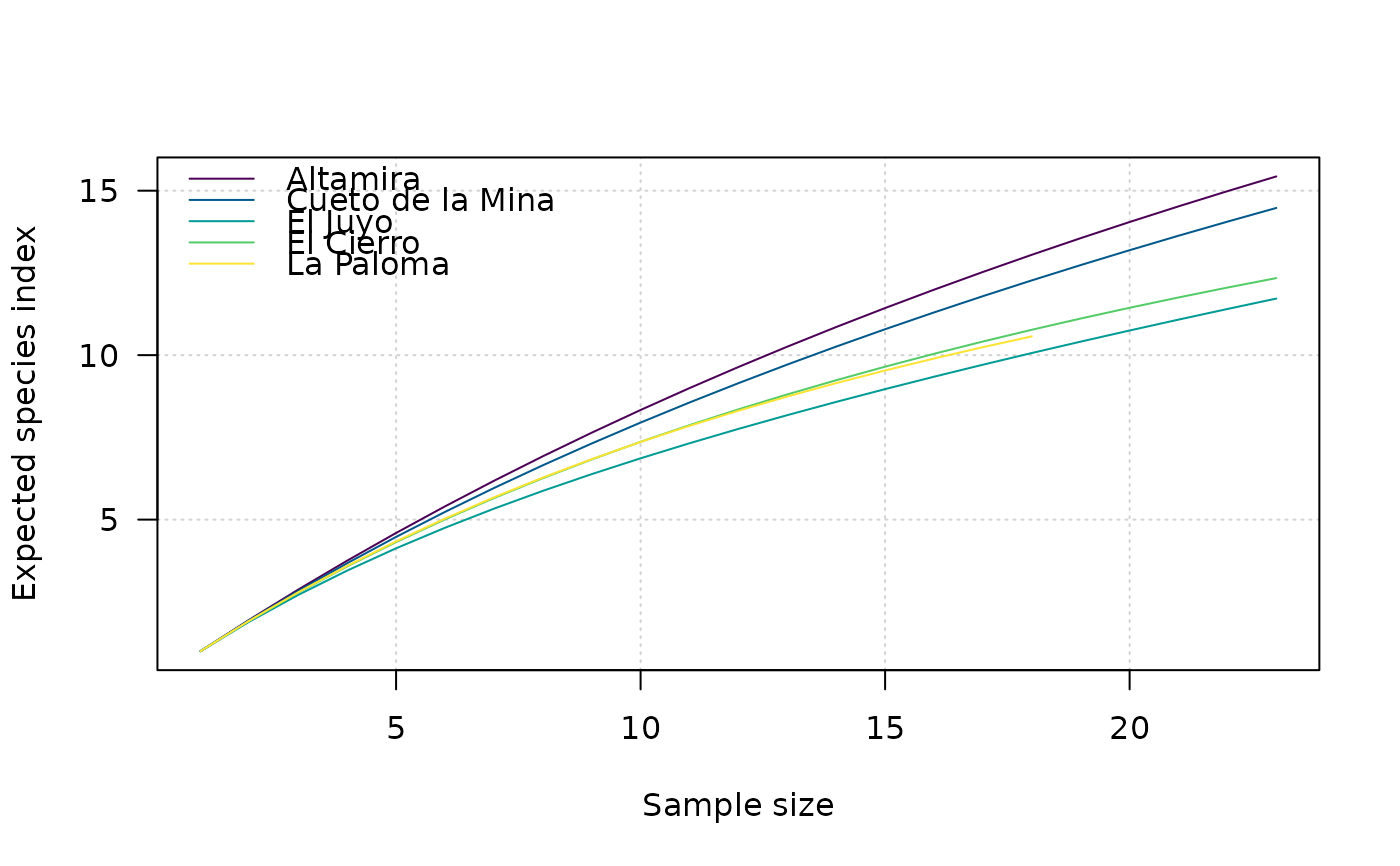
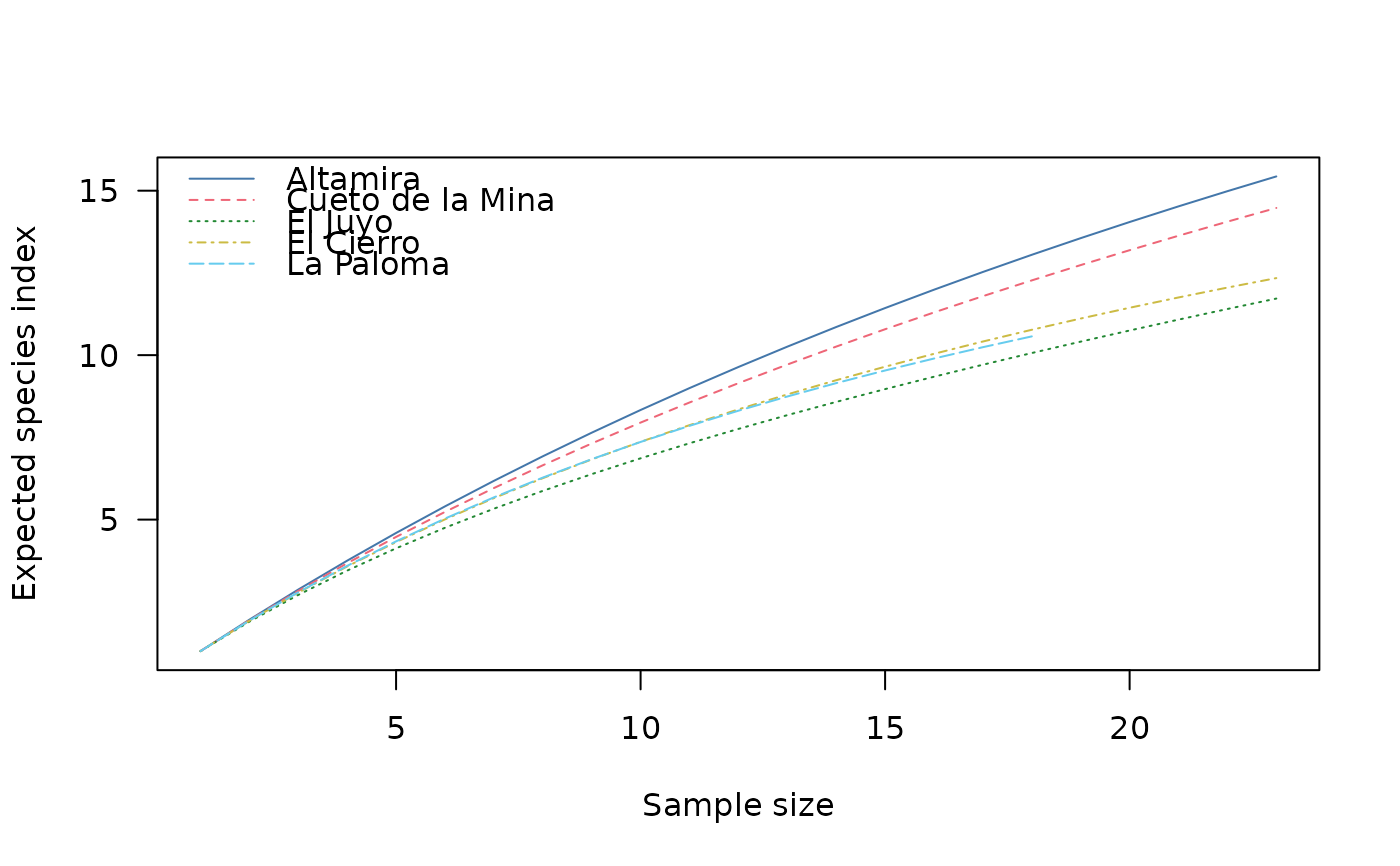
Rarefaction Plot
Arguments
- x
A RarefactionIndex object to be plotted.
- main
A
characterstring giving a main title for the plot.- sub
A
characterstring giving a subtitle for the plot.- ann
A
logicalscalar: should the default annotation (title and x, y and z axis labels) appear on the plot?- axes
A
logicalscalar: should axes be drawn on the plot?- frame.plot
A
logicalscalar: should a box be drawn around the plot?- panel.first
An an
expressionto be evaluated after the plot axes are set up but before any plotting takes place. This can be useful for drawing background grids.- panel.last
An
expressionto be evaluated after plotting has taken place but before the axes, title and box are added.- legend
A
listof additional arguments to be passed tographics::legend(); names of the list are used as argument names. IfNULL, no legend is displayed.- ...
Further graphical parameters to be passed to
graphics::lines().
Value
plot() is called for its side-effects: it results in a graphic being
displayed (invisibly returns x).
See also
Other diversity measures:
heterogeneity(),
occurrence(),
plot_diversity,
profiles(),
rarefaction(),
richness(),
she(),
similarity(),
simulate(),
turnover()