SHE Analysis
Usage
she(object, ...)

# S4 method for class 'matrix'
she(
  object,
  unbiased = FALSE,
  xlab = NULL,
  ylab = NULL,
  main = NULL,
  sub = NULL,
  ann = graphics::par("ann"),
  axes = TRUE,
  frame.plot = axes,
  panel.first = NULL,
  panel.last = NULL,
  legend = list(x = "right"),
  ...
)

# S4 method for class 'data.frame'
she(
  object,
  unbiased = FALSE,
  xlab = NULL,
  ylab = NULL,
  main = NULL,
  sub = NULL,
  ann = graphics::par("ann"),
  axes = TRUE,
  frame.plot = axes,
  panel.first = NULL,
  panel.last = NULL,
  legend = list(x = "right"),
  ...
)
Arguments
- object
A \(m \times p\)
numericmatrixordata.frameof count data (absolute frequencies giving the number of individuals for each category, i.e. a contingency table). Adata.framewill be coerced to anumericmatrixviadata.matrix().- ...
Further graphical parameters to be passed to
graphics::lines()andgraphics::points().- unbiased
A
logicalscalar: should the bias-corrected estimator be used (seeindex_shannon())?- xlab, ylab
A
charactervector giving the x and y axis labels.- main
A
characterstring giving a main title for the plot.- sub
A
characterstring giving a subtitle for the plot.- ann
A
logicalscalar: should the default annotation (title and x, y and z axis labels) appear on the plot?- axes
A
logicalscalar: should axes be drawn on the plot?- frame.plot
A
logicalscalar: should a box be drawn around the plot?- panel.first
An an
expressionto be evaluated after the plot axes are set up but before any plotting takes place. This can be useful for drawing background grids.- panel.last
An
expressionto be evaluated after plotting has taken place but before the axes, title and box are added.- legend
A
listof additional arguments to be passed tographics::legend(); names of the list are used as argument names. IfNULL, no legend is displayed.
Value
she() is called for its side-effects: it results in a graphic being
displayed (invisibly returns object).
Details
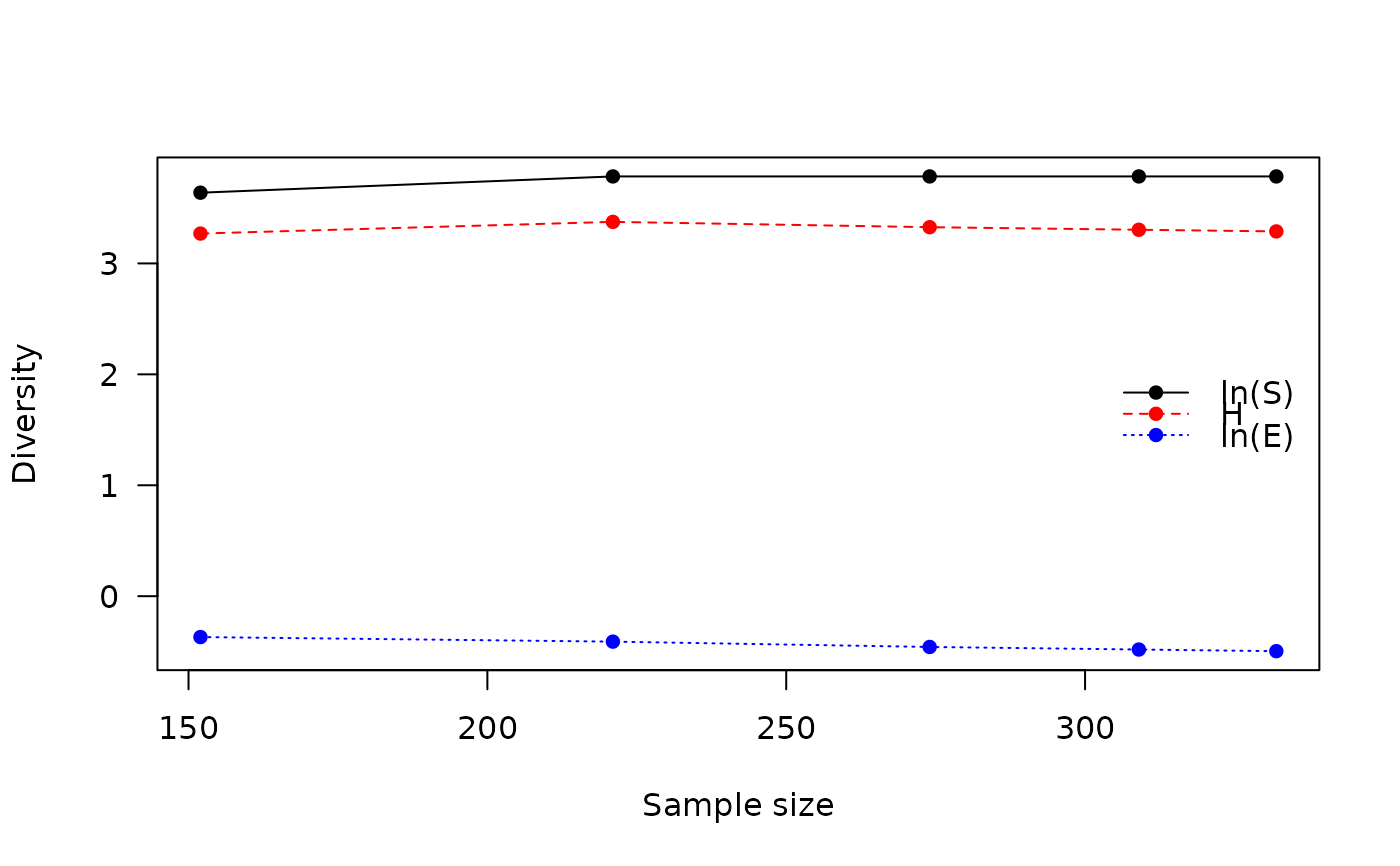
If samples are taken along a gradient or stratigraphic section, breaks in the curve may be used to infer discontinuities.
This assumes that the order of the matrix rows (from \(1\) to \(n\)) follows the progression along the gradient/transect.
References
Buzas, M. A. & Hayek, L.-A. C. (1998). SHE analysis for biofacies identification. Journal of Foraminiferal Research, 1998, 28(3), 233-239.
Hayek, L.-A. C. & Buzas, M. A. (2010). Surveying Natural Populations: Quantitative Tools for Assessing Biodiversity. Second edition. New York: Columbia University Press.
See also
Other diversity measures:
diversity(),
evenness(),
heterogeneity(),
occurrence(),
plot.DiversityIndex(),
plot.RarefactionIndex(),
profiles(),
rarefaction(),
richness(),
similarity(),
simulate(),
turnover()
Examples
## Data from Conkey 1980, Kintigh 1989
data("cantabria")

## SHE analysis
she(cantabria)