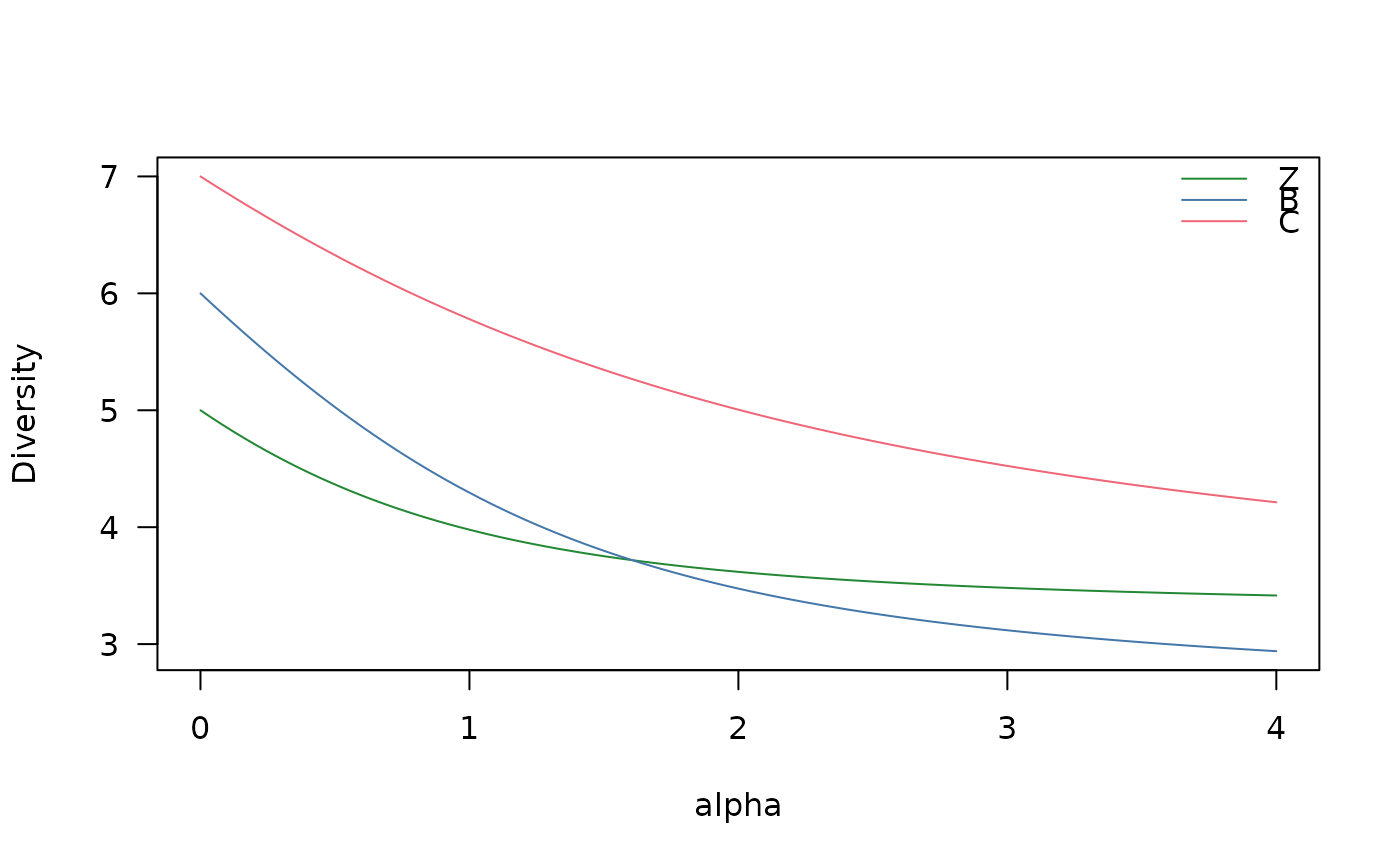
Diversity Profiles
Usage
profiles(object, ...)

# S4 method for class 'matrix'
profiles(
  object,
  alpha = seq(from = 0, to = 4, by = 0.04),
  color = NULL,
  symbol = FALSE,
  xlab = NULL,
  ylab = NULL,
  main = NULL,
  sub = NULL,
  ann = graphics::par("ann"),
  axes = TRUE,
  frame.plot = axes,
  panel.first = NULL,
  panel.last = NULL,
  legend = list(x = "topright"),
  ...
)

# S4 method for class 'data.frame'
profiles(
  object,
  alpha = seq(from = 0, to = 4, by = 0.04),
  color = NULL,
  symbol = FALSE,
  xlab = NULL,
  ylab = NULL,
  main = NULL,
  sub = NULL,
  ann = graphics::par("ann"),
  axes = TRUE,
  frame.plot = axes,
  panel.first = NULL,
  panel.last = NULL,
  legend = list(x = "topright"),
  ...
)
Arguments
- object
A \(m \times p\)
numericmatrixordata.frameof count data (absolute frequencies giving the number of individuals for each category, i.e. a contingency table). Adata.framewill be coerced to anumericmatrixviadata.matrix().- ...
Further graphical parameters to be passed to
graphics::lines()- alpha
A
numericvector giving the values of the alpha parameter.- color
A vector of colors (will be mapped to the rownames of
object). Ifcoloris a named a named vector, then the colors will be associated with the rownames ofobject. Ignored if set toFALSE.- symbol
A specification for the line type (will be mapped to the rownames of
object). Ifsymbolis a named a named vector, then the line types will be associated with the rownames ofobject. Ignored if set toFALSE.- xlab, ylab
A
charactervector giving the x and y axis labels.- main
A
characterstring giving a main title for the plot.- sub
A
characterstring giving a subtitle for the plot.- ann
A
logicalscalar: should the default annotation (title and x, y and z axis labels) appear on the plot?- axes
A
logicalscalar: should axes be drawn on the plot?- frame.plot
A
logicalscalar: should a box be drawn around the plot?- panel.first
An an
expressionto be evaluated after the plot axes are set up but before any plotting takes place. This can be useful for drawing background grids.- panel.last
An
expressionto be evaluated after plotting has taken place but before the axes, title and box are added.- legend
A
listof additional arguments to be passed tographics::legend(); names of the list are used as argument names. IfNULL, no legend is displayed.
Value
profiles() is called for its side-effects: it results in a graphic being
displayed (invisibly returns object).
References
Tóthmérész, B. (1995). Comparison of Different Methods for Diversity Ordering. Journal of Vegetation Science, 6(2), 283-290. doi:10.2307/3236223 .
See also
Other diversity measures:
diversity(),
evenness(),
heterogeneity(),
occurrence(),
plot.DiversityIndex(),
plot.RarefactionIndex(),
rarefaction(),
richness(),
she(),
similarity(),
simulate(),
turnover()