Measure Diversity by Comparing to Simulated Assemblages
Source:R/AllGenerics.R, R/resample.R
simulate.RdMeasure Diversity by Comparing to Simulated Assemblages
Usage
# S4 method for class 'DiversityIndex'
simulate(
  object,
  nsim = 1000,
  seed = NULL,
  step = 1,
  level = 0.8,
  interval = "percentiles",
  progress = getOption("tabula.progress"),
  ...
)
Arguments
- object
A DiversityIndex object.
- nsim
A non-negative
integerspecifying the number of simulations.- seed
An object specifying if and how the random number generator should be initialized (see
stats::simulate()).- step
An
integergiving the increment of the sample size.- level
A length-one
numericvector giving the confidence level.- interval
A
characterstring giving the type of confidence interval to be returned. Currently, only "percentiles" is supported (sample quantiles, as described in Kintigh 1984)..- progress
A
logicalscalar: should a progress bar be displayed?- ...
Currently not used.
Value
Returns a DiversityIndex object.
References
Baxter, M. J. (2001). Methodological Issues in the Study of Assemblage Diversity. American Antiquity, 66(4), 715-725. doi:10.2307/2694184 .
Kintigh, K. W. (1984). Measuring Archaeological Diversity by Comparison with Simulated Assemblages. American Antiquity, 49(1), 44-54. doi:10.2307/280511 .
See also
Other diversity measures:
diversity(),
evenness(),
heterogeneity(),
occurrence(),
plot.DiversityIndex(),
plot.RarefactionIndex(),
profiles(),
rarefaction(),
richness(),
she(),
similarity(),
turnover()
Examples
# \donttest{
## Data from Conkey 1980, Kintigh 1989
data("cantabria")
## Assemblage diversity size comparison
## Warning: this may take a few seconds!
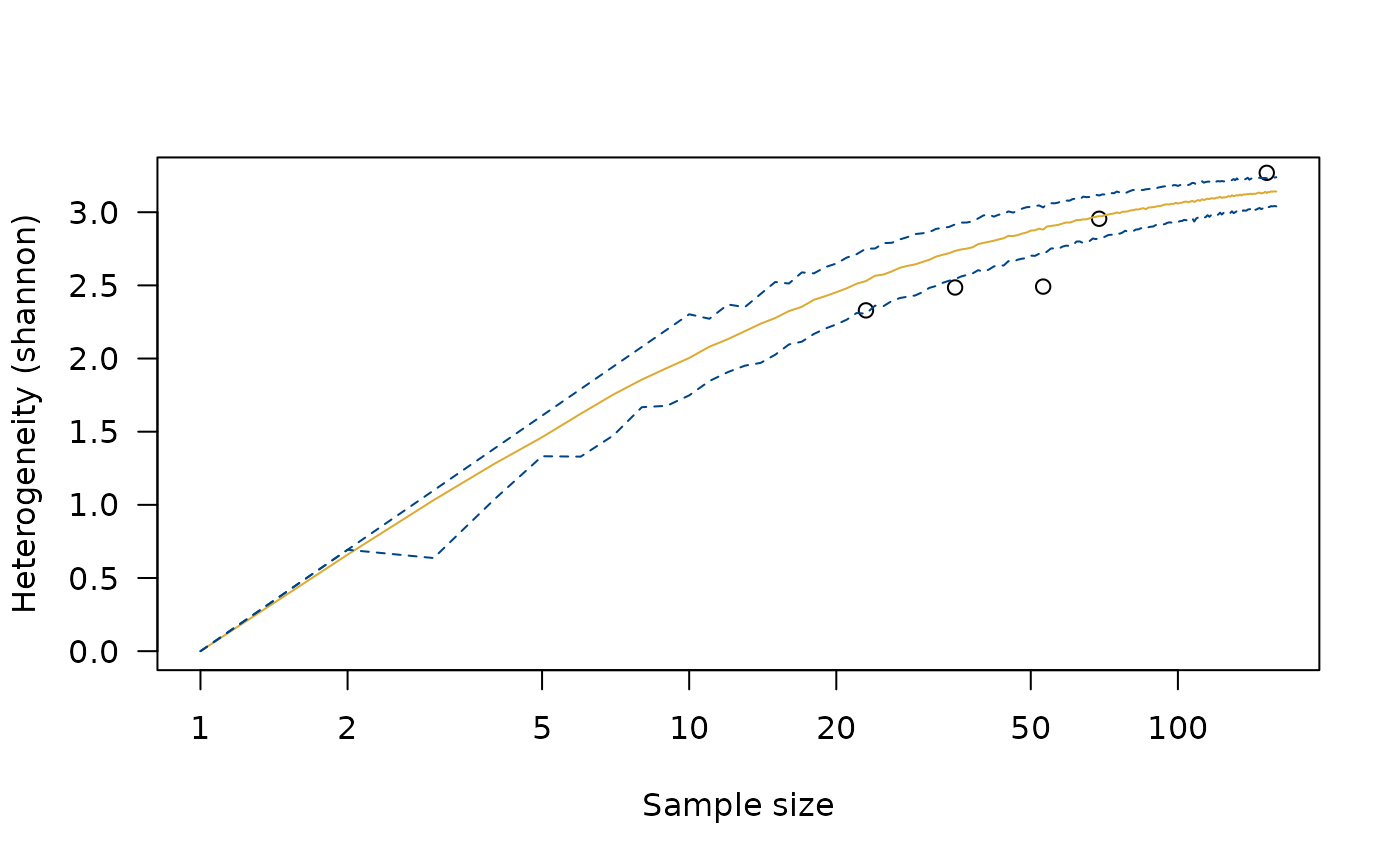
h <- heterogeneity(cantabria, method = "shannon")
h_sim <- simulate(h)
plot(h_sim)
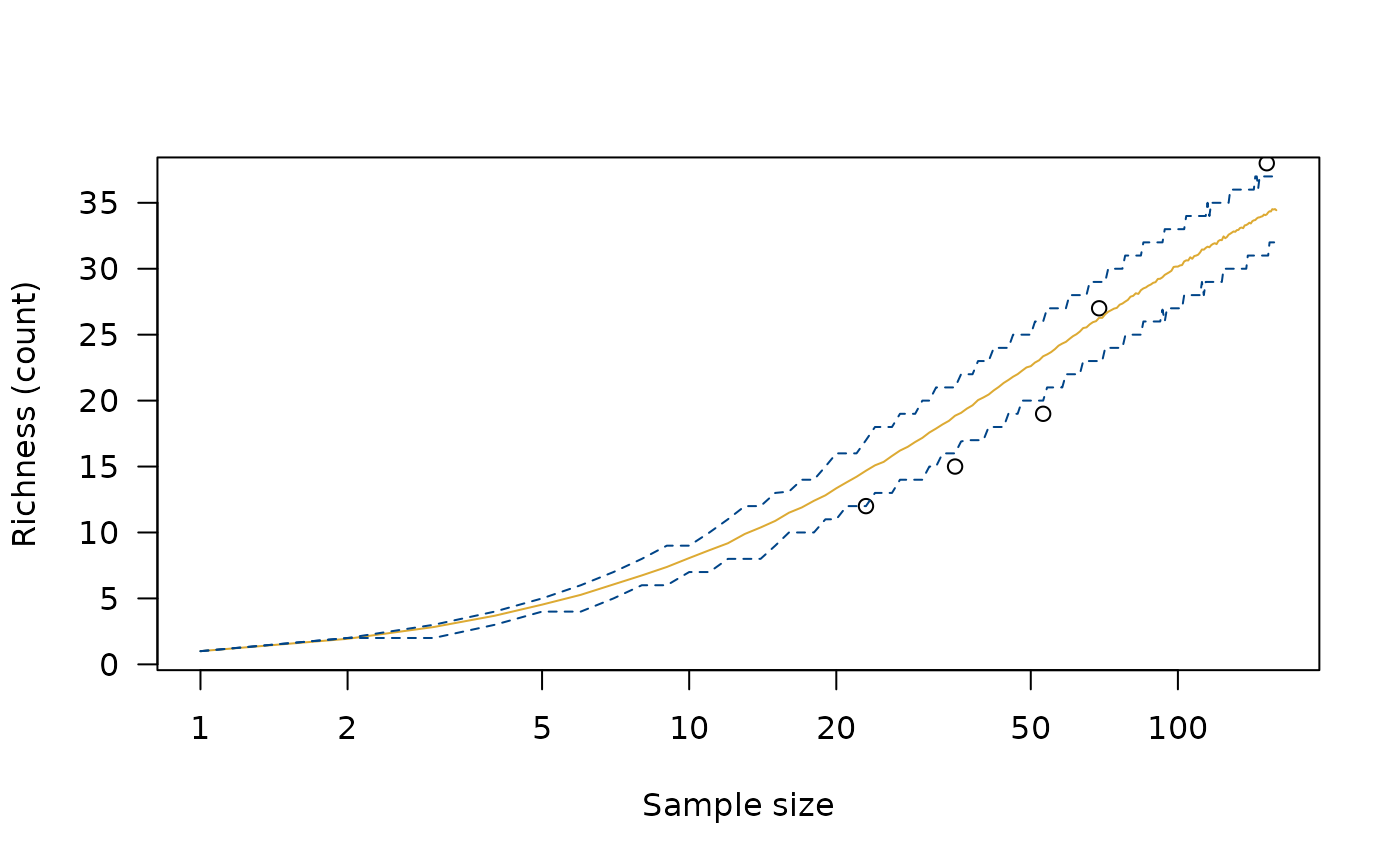
 r <- richness(cantabria, method = "observed")
r_sim <- simulate(r)
plot(r_sim)
r <- richness(cantabria, method = "observed")
r_sim <- simulate(r)
plot(r_sim)
 # }
# }